
It’s a Saturday night and the restaurant is slammed — every table full, the kitchen’s cranking, the bar’s three deep. Or maybe it’s your boutique on a Saturday afternoon and the register hasn’t stopped ringing since noon. It feels like the best day you’ve had in weeks. Then the month closes out and the bank balance tells a different story than the register did. That gap is what transaction profitability is all about — whether each sale actually made you money, not just how busy you were.
Busy Isn’t the Same as Profitable
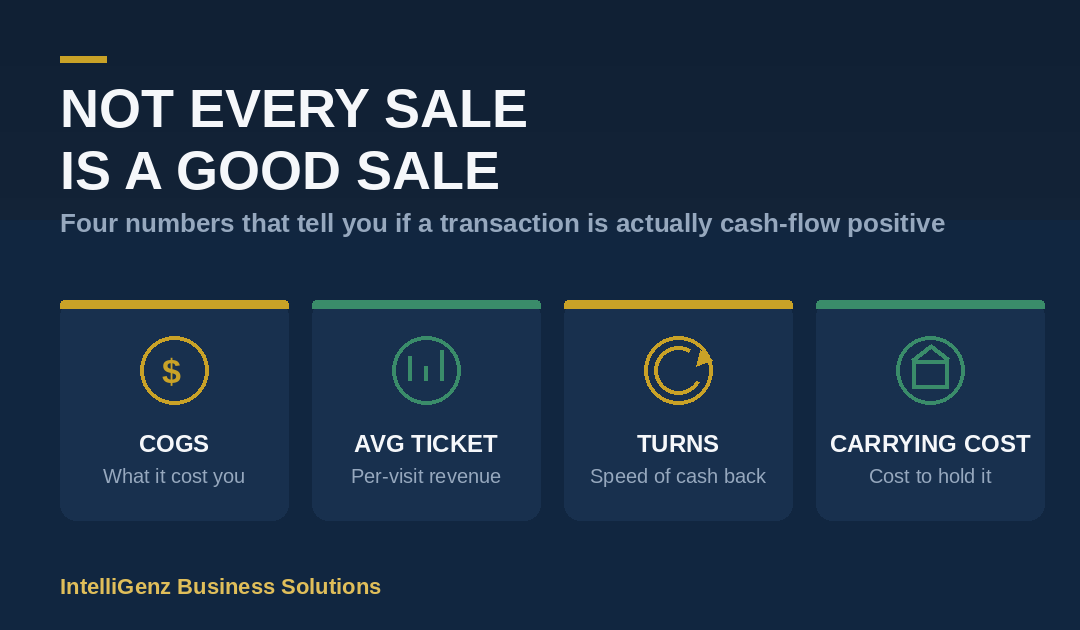
A full house or a busy register only tells you one thing: you had volume. It doesn’t tell you whether any of those individual sales actually made you money once you account for what they cost you to deliver. A $22 entrée that took $9 in food cost, a server, and 40 minutes of table time isn’t automatically a “good” sale — it depends on the math behind it. That math has a name, and it’s worth knowing four numbers cold: cost of goods sold, average ticket, inventory turns, and carrying costs.
Start With What the Sale Actually Cost You
Cost of Goods Sold (COGS) is the direct cost of whatever you sold — the beans and milk in a latte, the wholesale cost of a sweater, the raw ingredients on a plate. A $5 latte that costs you $1.75 in ingredients is a healthy 65% margin. A $58 sweater you bought for $40 wholesale is a much thinner 31%. Same “sale,” very different transaction. If you don’t know your COGS by item or category, you’re pricing — and promoting — half blind.
Average Ticket: Are You Covering Your Costs Per Visit?
Average ticket is simply total sales divided by the number of transactions, covers, or customers. If your average ticket is $18 but it costs you $14 per table in food, labor, and overhead to earn it, you’re barely breaking even — and any slow Tuesday puts you underwater. Average ticket tells you whether you need to sell more per visit, not just more visits.
Inventory Turns: How Fast Does Your Cash Come Back?
Inventory turns measure how many times you sell through and replace your inventory in a year — COGS divided by average inventory value. A shop that turns inventory 12 times a year gets its cash back roughly every month. A shop turning it 4 times a year has cash sitting on the shelf for three months at a stretch. Same margin, very different cash flow — the faster you turn, the sooner that money’s available to pay rent, payroll, or your next order.
Carrying Costs: What It’s Costing You to Just Hold It
Every day inventory sits unsold, it’s costing you something — storage space, insurance, spoilage, markdowns, and the simple fact that cash tied up in a backroom isn’t cash you can use elsewhere. A common rule of thumb is that carrying costs run 20–30% of inventory value per year. That sweater with a healthy 31% margin can lose most of that margin if it sits on the rack for four months before it sells.
Putting Transaction Profitability Together
A transaction — or a product line — is truly cash-flow positive when the ticket covers its COGS and its share of carrying costs, and it turns fast enough that your cash isn’t parked for months at a time. Run those four numbers on your top sellers and your slow movers side by side, and you’ll usually find at least one item that looks great on the register tape and drags on your bank account. That’s transaction profitability in practice — and it’s exactly what we help clients dig into.
If you’ve never broken your numbers down this way, that’s exactly where we come in — let’s talk about digging into your real cost, ticket, and turn numbers so you know which sales are actually building your business.